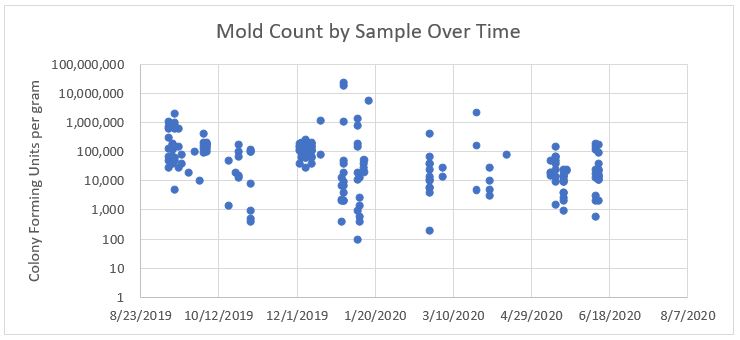
Figure 1. Colony forming units (CFU) of mold found on corn samples submitted to Kemin CLS since harvest.
Mycotoxin Report Summary
- So far in 2019/20, Kemin CLS has evaluated 192 corn samples for mycotoxins.
- The mycotoxin levels in the 2019/20 corn crop are about the same as the prior year with one exception.
- The level of Fumonisin is down significantly. In 2018/19, 74% of corn sample arriving in the Kemin lab contained detectable levels of Fumonisin, and in 2019/20 it is found in 37% of samples. Average levels are down from 2.73 ppm last year to 1.83 ppm this year. It is still a serious concern for horse and swine producers, but much lower than last year.
Table 1. Percent of corn samples with mycotoxins and levels of those submitted to Kemin CLS since harvest.*
Crop Harvest Year
|
2019/20
|
2018/19
|
2017/18
|
Samples
|
192
|
152
|
143
|
Aflatoxin
|
5% (31 ppb)
|
5% (27 ppb)
|
1% (28 ppb)
|
Zearalenone
|
26% (125 ppb)
|
27% (143 ppb)
|
24% (151 ppb)
|
T-2 Toxin
|
31% (50 ppb)
|
33% (48 ppb)
|
52% (44 ppb)
|
DON
|
22% (1.10 ppm)
|
31% (1.29 ppm)
|
40% (1.22 ppm)
|
Fumonisin
|
37% (1.83 ppm)
|
74% (2.73 ppm)
|
33% (3.18 ppm)
|
Multiple Toxins
|
31%
|
44%
|
48%
|
* Corn samples reported by Kemin CLS from October 3, 2017 thru May 25, 2018 and October 5, 2018 thru July 1, 2019 and from September 13, 2019 thru June 30, 2020.
- Aflatoxin – 10 samples with detectable levels (5%) and an average level of 31 ppb. The samples with detectable levels of aflatoxin all came from the southern USA where drought conditions were common.
- Zearalenone – 50 with detectable levels (26%)
- Average level of 125 ppb. This level is lower than prior years but can still lead to reproductive issues.
- T-2 Toxin - 59 with detectable levels (31%)
- Average level of 50 ppb – mouth lesions have been reported in birds at 100 ppb.
- The percentage of samples arriving with T-2 toxins is about the same as last year, but the level of T-2 toxin in the samples is higher than what was found in 2019 corn.
- DON (Vomitoxin) - 42 with detectable levels (22%)
- Average level of 1.10 ppm – feed consumption issues in swine possible.
- Average level of DON is low when compared with the last two years.
- Fumonisin – 71 with detectable levels (37%)
- Average level of 1.83 ppm. We are seeing much less Fumonisin in corn samples this year compared with prior years.
31% of all samples had more than one toxin.
KEMIN RECOMMENDATIONS
First, contact your Kemin Animal Nutrition & Health – North America representative for more information on implementing a comprehensive mold and mycotoxin control program. Your Kemin representative has information and expertise which will increase the effectiveness of your program. Or simply email KeminAg@kemin.com.
Second, complete the following:
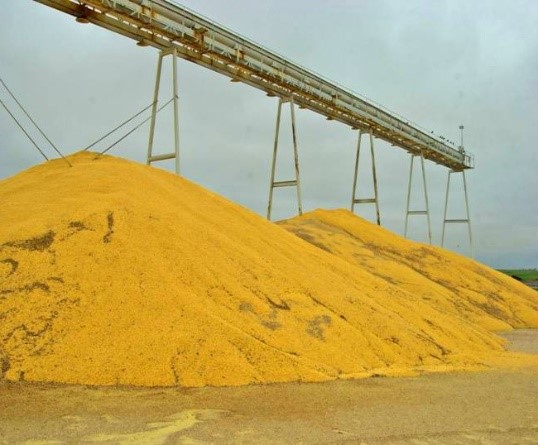
- Test all incoming grain. Samples submitted to Kemin CLS are showing high levels of fusarium mold - which is consistent with a wet growing season.
- Check new corn silage for mold and mycotoxins. If these problems are found in the grain, we will see them in the corn silage, as well.
- Treat grain with Myco CURB® Liquid or Myco CURB® Dry to prevent further mold growth.
- Use Ultra CURB® Liquid or Ultra CURB® Dry in all dairy TMR's to control both mold and wild yeast.
- Use products like KALLSIL™ and FloMatrix® in all rations. Mycotoxins impact animal performance – even at low levels.
- This corn crop will not improve – continue to monitor the condition of grain during summary storage.
References
1World Agricultural Supply and Demand Estimates, United State Department of Agriculture, WASDE-602, Released by the Agricultural Marketing Service on July 10, 2020. https://www.usda.gov/oce/commodity/wasde/wasde0720.pdf. Accessed July 10, 2020.
2Data from Kemin CLS corn samples submitted as part of an annual monitoring program.
3Bartov, I., N. Paster, and N. Lisher. 1982. Poultry Science. 61:2247-2254.
4Kao, C., and R. J. Robinson. 1972. J. Food Sci. 37:261.
5www.extension.psu.edu. Accessed on Dec. 28, 2017.
FloMatrix® is a registered trademark of Purina Animal Nutrition, Arden Mills, MN.