The United States Department of Agriculture (USDA), in its April 3, 2021 World Agricultural Supply and Demand Estimates (WASDE) Report, lowered the ending corn stocks by 150 million bushels (4.2 million tons). This reduction in ending stocks was largely driven by the increased export of corn from 2.6 million bushels projected in the March report to 2.675 million bushels in the April report. This report was taken as a bullish signal for the market, and corn prices rose with the news.
You are viewing United States
A global presence, with local expertise. Visit our regional sites:
- United States
- Canada
- Mexico
- South America
- EMENA
- Sub-Saharan Africa
- Russia
- South Asia
- Asia Pacific
- China
A global presence, with local expertise. Visit our regional sites:


- United States
- Canada
- Mexico


South America


EMENA


Sub-Saharan Africa


Russia


South Asia


Asia Pacific


China
You are leaving to visit our {} regional site. What is your language preference?
Please confirm your language preference for the selected region.
Popular Searches
- Animal Nutrition & Health
- 2020-2021 Kemin Mold and Mycotoxin Report
2020-2021 Kemin Mold and Mycotoxin Report
Animal Nutrition & Health
The information related to ending stocks helps explain the data in this quarterly corn quality report from Kemin. Quite frankly, the corn samples received in the Kemin Customer Service Laboratory (CLS) have been low quality. Mold and mycotoxin levels are greater than prior years – especially in corn from the Eastern Corn Belt. Part of the increase is attributed to the cool, wet growing conditions in this region late in 2020. Another reason for the poor-quality corn is the low ending stocks. Every kernel of corn in storage is being used for feed or food. Reduced ethanol production means poor quality corn is being fed to livestock and poultry. In 2018-2019, ethanol production used 5.4 billion bushels of corn, compared to 4.9 billion bushels used last year for ethanol production. Corn growers seldom sell their best corn to the ethanol plants, so this year, 500 million extra bushels were sold for feed rather than sold for ethanol.
Mold Levels
Overall, the corn samples submitted to Kemin for mold evaluation show a similar pattern when compared to the mold levels found over the past few years. Corn harvested in 2020 is highly variable with many samples containing mold and mycotoxins levels which generate concern. Figure 1 shows the mold counts over time since harvest began in September. The average mold count in 2020-2021 is 410,000 colony forming units per gram (CFU/g) compared with 499,000 CFU/g for the prior year average. The biggest change from last year is the number of samples with over 1 million CFU/gram. Twelve percent of the samples submitted have had over 1,000,000 CFU/g and 51% of the samples have over 100,000 CFU/g. Please note, the scale of the figure is logarithmic.
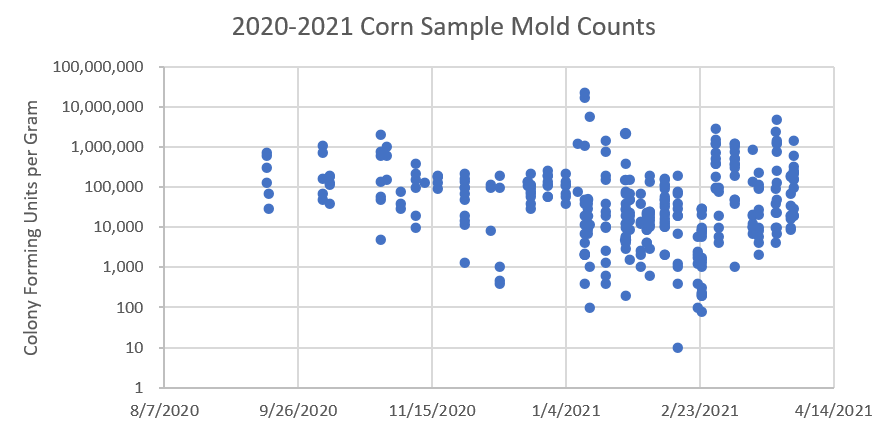
Figure 1. Colony forming units per gram (CFU/g) of mold found on corn samples submitted to Kemin CLS.2
The figure shows large variations in mold counts with recent samples. Immediately after harvest, these samples came primarily from the upper Midwest (Iowa, Minnesota and Illinois). The later samples in January were from the southern corn belt (Kansas, Arkansas and Missouri). Because the growing season was cooler and wetter, there were more mold and more mycotoxins in these samples when compared with early season samples. Also, the variability is greater as more corn comes out of long-term storage. As previously mentioned, Eastern Corn Belt samples (Figure 2) are showing increasing levels of mold as the year has progressed.
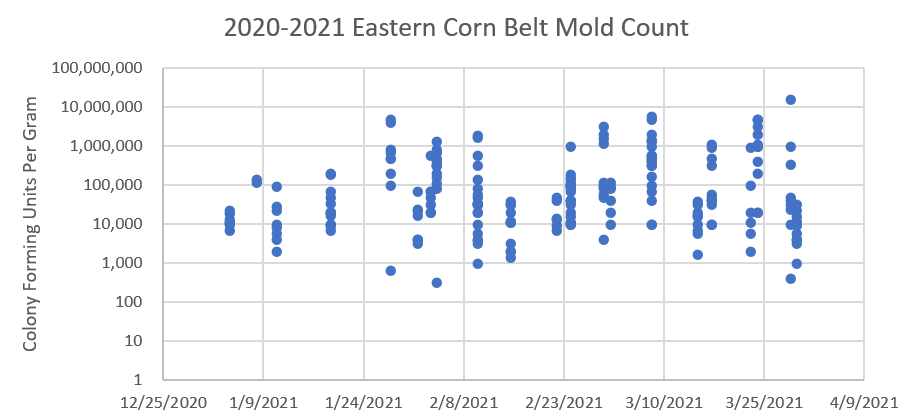
Figure 2. Colony forming units per gram (CFU/g) of mold found on corn samples from Eastern Corn Belt States.2
Regionally, we are seeing the following for mold:
- Upper Midwest (MN, IA, SD, WI) – low levels of mold. Counts are averaging less than 100,000 CFU/gram and the primary mold is Fusarium spp.
- Eastern Corn Belt (IL, IN, OH, PA) – high levels of mold. Counts are averaging 450,000 CFU/gram. There is great variability in the samples with many exceeding 1 million but some showing mold counts below 1,000.
- Southern Corn Belt (MO, AR, OK) – poor quality, high levels of mold. Counts are routinely over 1,000,000 CFU/gram. The Kemin database for this region is limited with fewer than 30 samples, but the quality from this area is low because of the cold, wet growing season in 2020.
Which mold species are most common in 2021?
Of the 329 samples submitted for mold evaluation, Kemin evaluated 198 corn samples for mold species. Since harvest, the most common mold found was Fusarium spp. More than one mold species was found in 46% of the corn samples submitted, and 97% of the corn samples submitted had Fusarium mold. Fusarium mold is classified as a "field mold" because it requires available water to multiply. It will often appear white to pink in color. However, the classification as a field mold does not mean it will not grow in storage. The second most common mold species, found in 42% of the corn samples submitted, was Penicillium spp. This is a storage mold and will often appear gray or greenish in color. The three mycotoxins produced by Penicillium spp. are ochratoxin, citrinin and patulin.
Table 1. Summary of mold found on corn samples submitted to Kemin CLS.2
|
Number of Samples |
Percent of Mold Identified |
Corn samples submitted for mold count |
329 |
- |
Corn samples submitted for mold identification |
198 |
- |
Samples with more than one mold identified |
91 |
46% |
Fusarium (alone or in combination) |
191 |
&97% |
Fusarium alone |
103 |
52% |
Penicillium mold |
83 |
42% |
Trichoderma mold |
12 |
6% |
Aspergillus mold |
15 |
8% |
Mucor mold |
6 |
3% |
The presence of mold in feed is not often considered an issue in livestock and poultry production, but research demonstrates the detrimental impact mold can have on performance. Research by Bartov, published in The Journal of Poultry Science in 1982, showed mold development reduced fat content from 3.9% to 2.2%.3 Research by Kao and Robinson in 1972 showed that mold growth had a dramatic effect on the nutritional content of grain and feed.4 Finally, for dairy cattle, Penn State University suggests that digestibility of moldy feed may be decreased enough to reduce energy content by 5%.5 Such feeds are also less palatable and may lower the intake of energy, dry matter and critical nutrients.
Mycotoxin Levels
Kemin CLS also evaluates corn samples for mycotoxin levels. Mycotoxins are formed by mold under certain conditions. While molds form mycotoxins, it is important to note that the presence of mold does not mean mycotoxins are also present. By the same token, mycotoxins are often found when mold is no longer detected. Also of note, once a mycotoxin is formed, it does not degrade.
Since the conclusion of the 2020-2021 harvest, Kemin CLS has evaluated 298 corn samples for the presence of mycotoxins (Table 2). Notice that 69% of the corn samples have more than one mycotoxin. This is particularly important to note as multiple toxins can have a pronounced and additive impact on livestock performance. Another issue with the 2020-2021 corn crop is the presence of high levels of zearalenone and deoxynivalenol (DON or vomitoxin).
Of corn samples tested in the Kemin CLS Lab, 64% of the samples have detectable levels of zearalenone with an average level of 248 ppb. The United States Food and Drug Administration (FDA) has not established guidance levels for zearalenone6; however, zearalenone has a chemical structure like estrogen and can produce estrogenic responses in animals. Swine are very sensitive to zearalenone, as well as ruminants.7
The Kemin CLS Lab found 43% of samples tested had detectable levels of DON. The average level was 2.69 ppm. The FDA has issued a guidance document regarding advisory levels for DON levels for grains and grain by-products used for animal food. This guidance is available on the FDA website.8 Depending on the species, FDA advisory levels for grain begin with 1 ppm in the total ration for swine, 5 ppm for chickens and 5 ppm for dairy cattle. Consult the FDA website for more information on the advisory levels for DON.8
Table 2. Summary of mycotoxins found on corn samples submitted to Kemin CLS.2
|
Number of Samples |
Percentage of Total |
Average Level |
Corn samples submitted for mycotoxin evaluation |
298 |
- |
N/A |
Corn samples with more than one mycotoxin |
206 |
69% |
N/A |
Aflatoxin |
4 |
1% |
21 ppb |
Zearalenone |
191 |
64% |
248 ppb |
T-2 Toxin |
82 |
28% |
55 ppb |
DON (Vomitoxin) |
218 |
73% |
2.68 ppm |
Fumonisin |
129 |
43% |
2.69 ppm |
Kemin Recommendations
First, contact your Kemin representative for more information on implementing a comprehensive mold and mycotoxin control program. Your Kemin representative has information and expertise which will increase the effectiveness of your program.
Second, complete the following:
- Test corn for mold and mycotoxins – storage conditions greatly impact grain quality.
- With mold counts near threshold levels that can impact performance of the 2020-2021 corn supply, use Myco CURB® Dry at 2 lbs./ton or Myco CURB® Liquid at 2 lbs./ton to control mold growth in stored grain or complete feed.
- Use KALLSIL™ at 0.5-2.0 ounces/head/day in cattle or 2-4 pounds per ton of swine or poultry feed. KALLSIL is a dry anti-caking aid which helps reduce caking and improves flowability of feed ingredients. Published research has demonstrated that many anti-caking products can reduce several of the negative impacts associated with mold and mycotoxin contamination in feed.
References
1https://www.usda.gov/oce/commodity/wasde/wasde0421.pdf, accessed April 4, 2021.
2Data from Kemin CLS corn samples submitted as part of an annual monitoring program.
3Bartov, I., N. Paster, and N. Lisher. 1982. The nutritional value of moldy grains for broiler chicks. Poultry Science. 61:2247-2254.
4Kao, C., and R. J. Robinson. 1972. Aspergillus flavus Deterioration of Grain: Its Effect on Amino Acids and Vitamins in Whole Wheat. J. Food Sci. 37:261.
5Adams, R. S. K. B. Kephart and V. A. Ishler. Mold and Mycotoxin Problems in Livestock Feeding. Department of Dairy and Animal Science, Lawrence J. Hutchinson, Department of Veterinary Science, and Gregory W. Roth, Department of Agronomy. Access from https://extension.psu.edu/mold-and-mycotoxin-problems-in-livestock-feeding on December 23, 2018.
6CVM Annual Report on Mycotoxins in Animal Food. https://www.fda.gov/media/130526/download, accessed January 14, 2021.
7Dairyland Labs Mycotoxin Fact Sheets. https://www.dairylandlabs.com/molds-and-mycotoxins/mycotoxin-fact-sheets. Accessed January 14, 2021.
8Guidance for Industry and FDA: Advisory Levels for Deoxynivalenol (DON) in Finished Wheat Products for Human Consumption and Grains and Grain By-Products used for Animal Feed. https://www.fda.gov/regulatory-information/search-fda-guidance-documents/guidance-industry-and-fda-advisory-levels-deoxynivalenol-don-finished-wheat-products-human. Accessed January 14, 2021.
Have a Question?
If you have a question about our products and services, or just want more information, fill out the form below and someone on our team will be in contact with you.
Animal Nutrition & Health
Products
Careers
Careers
- California Residents
- California Supply Chain Act
- Email Disclaimer
- GDPR Personal Data Addendum
- General Terms & Conditions for Vendors
- Global Environmental Policy Statement
- Indirect Cost Estimates
- Kemin Terms & Conditions
- Modern Slavery Act Transparency Statement
- Privacy Policy
- Sitemap
© Kemin Industries, Inc. and its group of companies All rights reserved. ® ™ Trademarks of Kemin Industries, Inc., USA
Certain statements may not be applicable in all geographical regions. Product labeling and associated claims may differ based upon government requirements.
You are viewing United States
A global presence, with local expertise. Visit our regional sites:
- United States
- Canada
- Mexico
- South America
- EMENA
- Sub-Saharan Africa
- Russia
- South Asia
- Asia Pacific
- China
A global presence, with local expertise. Visit our regional sites:
- United States
- Canada
- Mexico
South America
EMENA
Sub-Saharan Africa
Russia
South Asia
Asia Pacific
China
Privacy Policy
By browsing this site you permit us and our partners to place identification cookies on your browser and agree to our use of cookies for marketing. Review our cookies policy for details.
Let's Work Together! Contact Us:
Contact Us
Email
Contact
Thank you for visiting Kemin.com.
Your questions and feedback are important to us. Let us know how we can help you learn more about Kemin, our products, our services or our website.
Interested in starting a career with Kemin?